NetScope
A clearer command center for a home network.
NetScope started with a familiar frustration: router admin pages are often dated, cryptic, or strangely limited. I wanted one place to see what is connected, understand where traffic is going, check whether slow internet is the Wi-Fi or the ISP, and safely handle basic router operations. So I built a local-first dashboard that turns raw network signals into an interface I actually want to use.
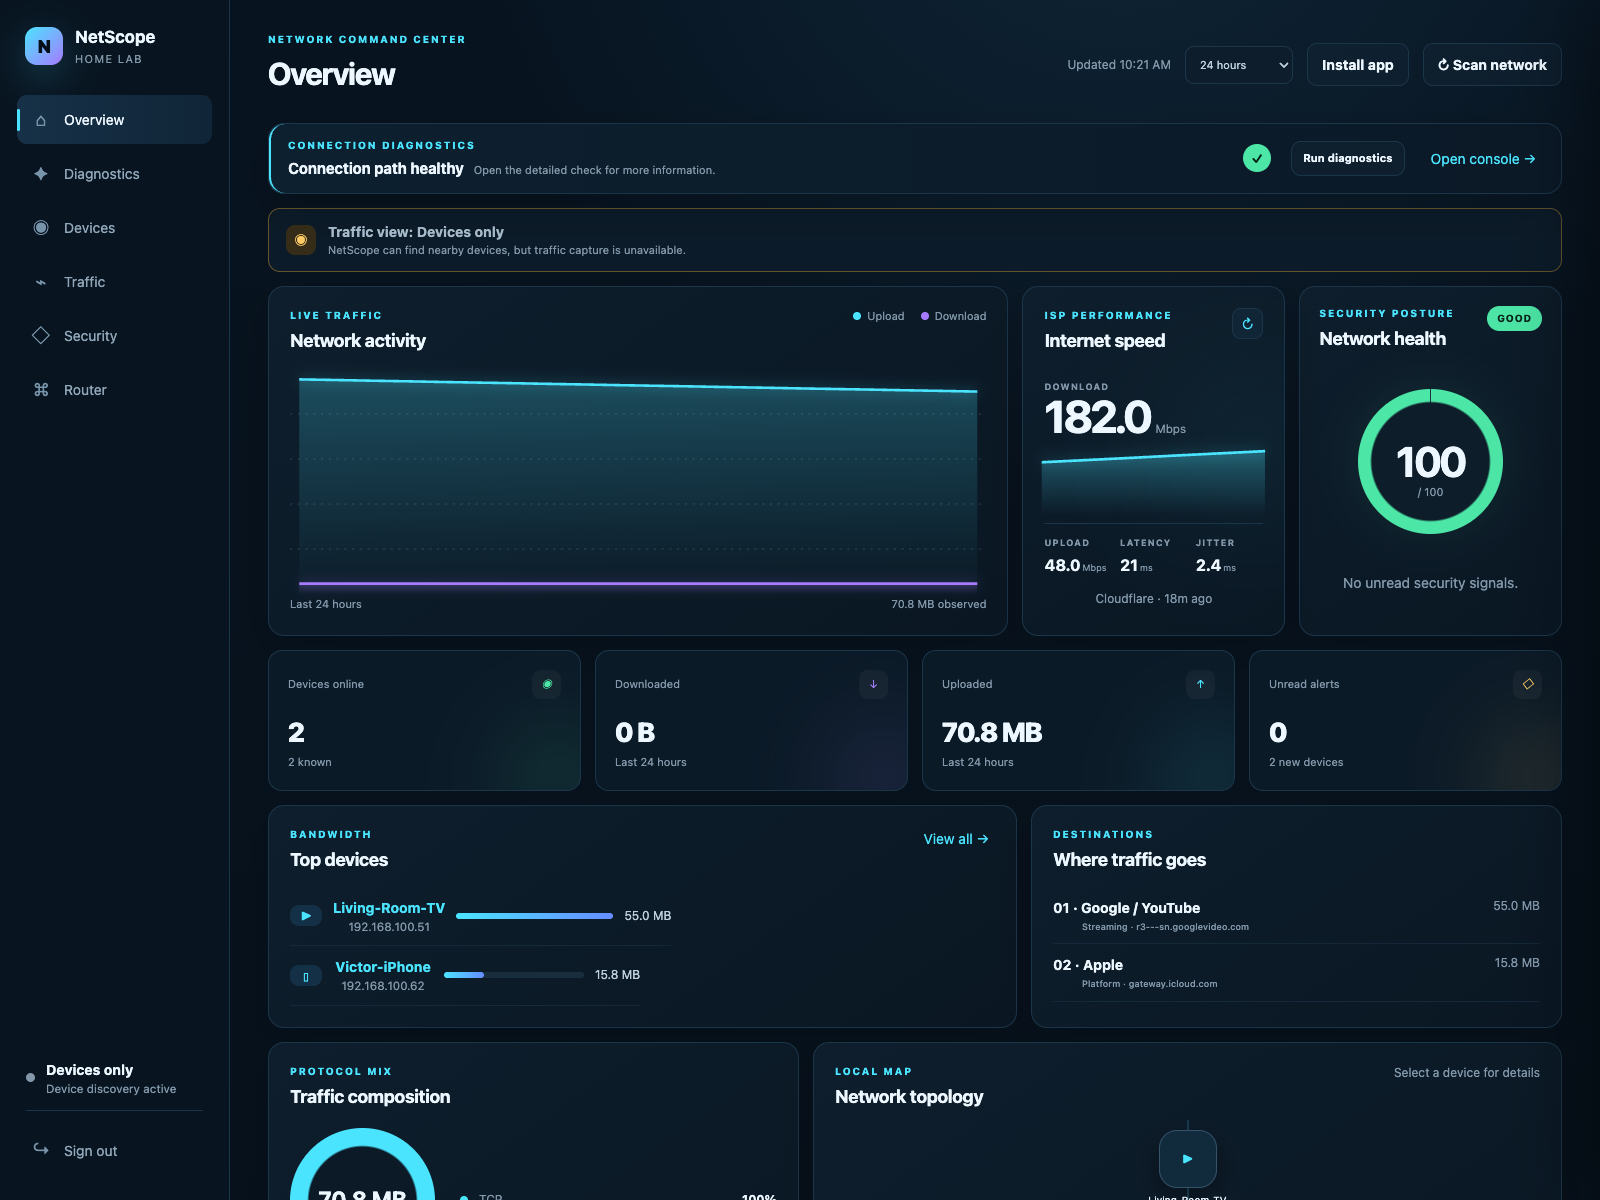
The frustration
Router pages often expose settings without helping explain what is happening. I wanted to move from “the internet feels slow” to a useful next question: is the problem the local connection, DNS, or the ISP path?
Product decisions
- Local-first. Keep observations on the installation, with a readable dashboard and a PWA interface.
- Useful without full capture. Automatic subnet and device discovery, online/offline history, connection diagnostics and ISP uptime provide value even when traffic visibility is limited.
- Measurements with limits. Bounded speed tests report their transferred bytes; per-device analytics describe observed traffic rather than claiming complete coverage.
- Deliberate controls. Alerts surface changes; router operations are disabled by default and require explicit setup and confirmation.
Technical architecture
A JavaScript dashboard talks to a Python/FastAPI backend. SQLAlchemy and SQLite keep device history, diagnostic results and audit events locally. Scapy supports device discovery and optional traffic collection; background jobs refresh observations and apply retention rules.
Traffic records contain metadata (addresses, ports, protocols, timestamps and byte counts), not packet payloads. Observed DNS answers support destination attribution, with per-device analytics built from the traffic the collector can actually see.
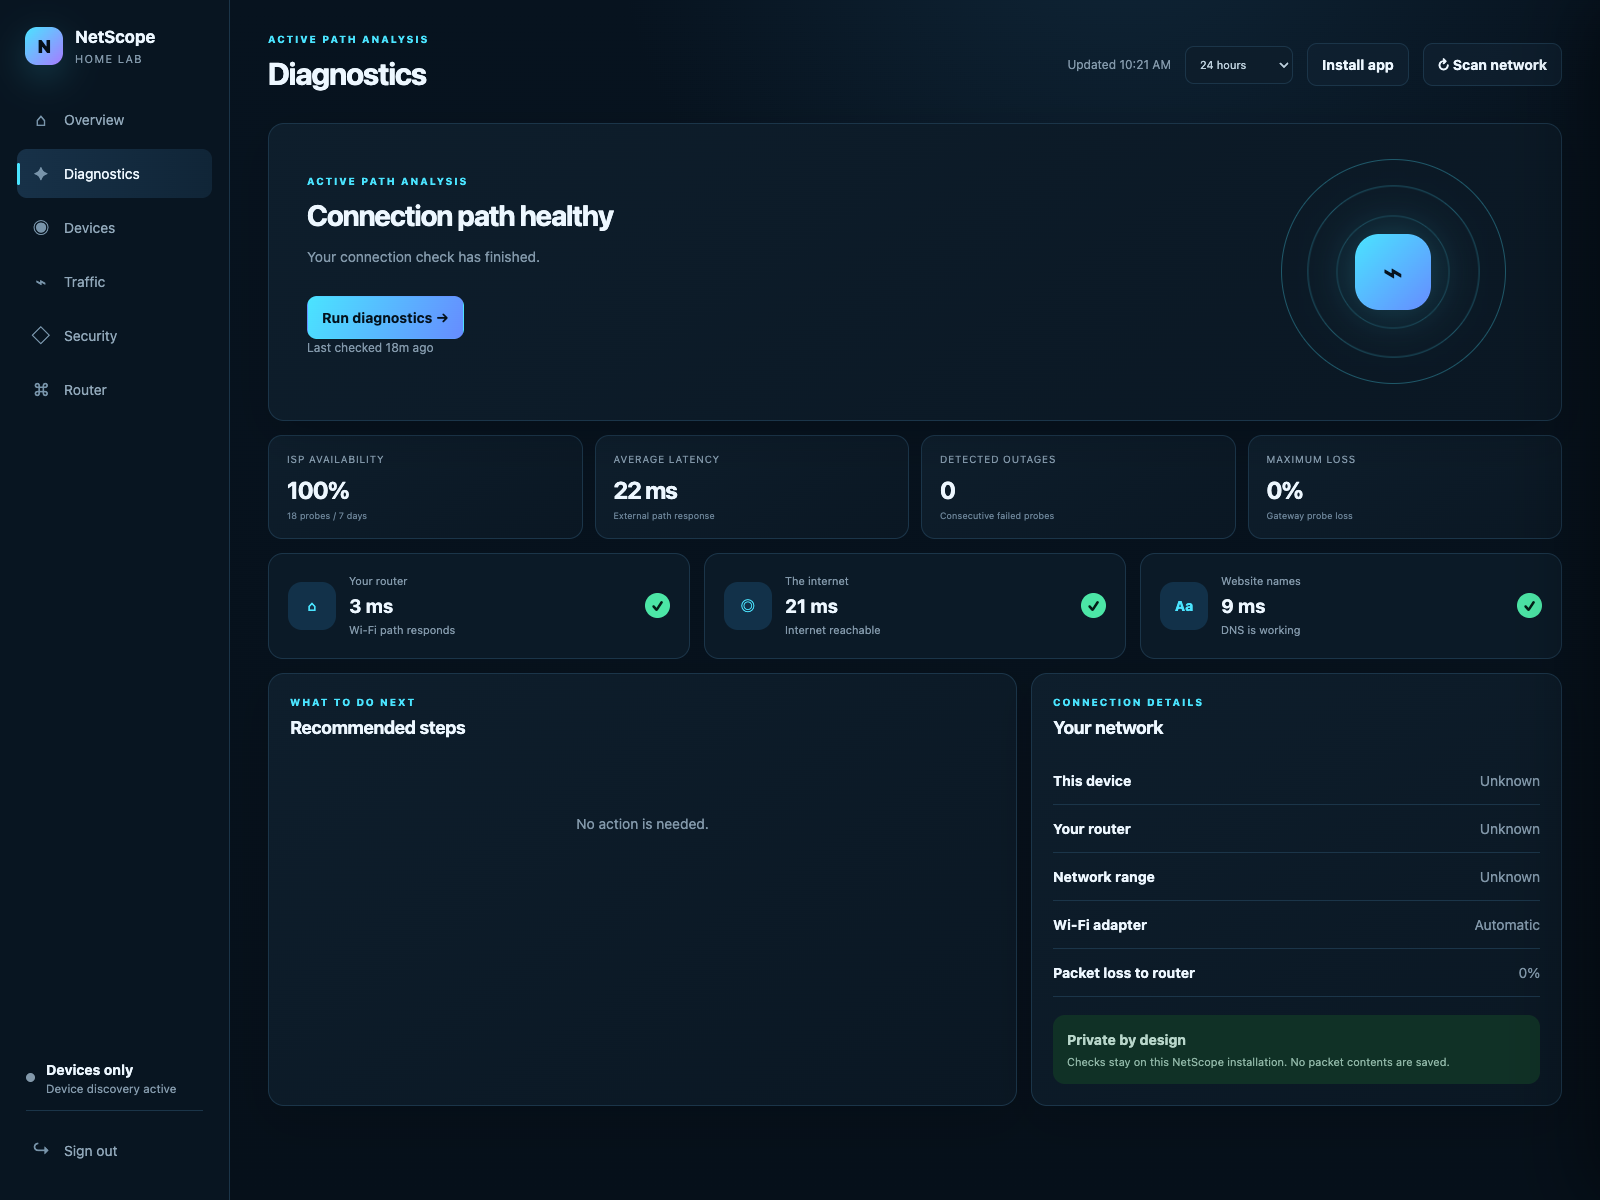
Privacy and safety boundaries
NetScope stores metadata, not packet payloads, and is intended only for networks the owner is authorized to administer. Metadata can still reveal device and browsing patterns, so access and retention matter.
On ordinary switched Wi-Fi, a computer cannot automatically see every other device’s traffic. Whole-network visibility requires suitable router-side collection, a mirror port, or supported access-point telemetry. Diagnostics offer evidence about likely causes, not proof of every Wi-Fi or ISP fault.
Local authentication, CSRF protection, confirmation, rate limits and audit logging guard state-changing operations. Router adapters need explicit configuration; a dashboard label does not itself enforce a network block.
What I learned
The central design lesson was to make incomplete visibility understandable. Device discovery and traffic observation answer different questions; presenting them as the same thing would create false confidence.
A useful dashboard helps someone choose the next diagnostic step. More measurements only help when their limits and meaning are clear.
What I would build next
I would focus on tested router integrations, clearer setup guidance for always-on collectors, and longer-term comparisons that help distinguish a recurring connection problem from a one-off event. These are next steps, not shipped capabilities.